


Every options trader knows the fundamental trade-off: you can collect theta, but you expose yourself to vega. You can position for a volatility spike, but you’ll bleed premium when the market goes quiet. It’s a constant battle, and most strategies resolve it by picking a side. Either you’re a premium seller who accepts that volatility spikes will hurt, or you’re a volatility buyer who accepts that slow markets will bleed you dry.
So when a strategy claims to handle both rising and falling volatility while generating consistent income, skepticism is the only rational response.
But what if it actually worked? 
What Is the Flyagonal Options Strategy?
Meet the Flyagonal (also known as the “Combo”) – a hybrid options strategy popularized by Steve Ganz, a veteran options educator with over 30 years of market experience across stocks, commodities, futures, and options. Ganz traded it live and documented every trade publicly. Across 110 live trades through October 2025, 104 closed as winners – a 94.55% win rate generating approximately $30,000 in profits over six months. The average hold time was 5.1 days.
The Flyagonal fuses two familiar structures: a call broken-wing butterfly and a put diagonal spread into a single, defined-risk position. The combination neutralizes each leg’s primary weakness. The result is a setup with wide profit zones and self-balancing Greeks that functions across a range of market conditions. The name is a portmanteau: fly (butterfly) + agonal (diagonal). It describes exactly what the trade is.
Before moving to construction, there is a more important conceptual point to internalize; one that distinguishes traders who use the Flyagonal well from those who misapply it.
If you’re already trading iron condors, calendars, or broken wings, the Flyagonal might be the most valuable addition to your playbook in years. But it rewards careful understanding before it rewards capital.
Anatomy of the Flyagonal
To understand why the Flyagonal works, you need to understand what each component does independently, including what each one fails at alone.
The call broken-wing butterfly is placed above the current price. A standard butterfly profits when the underlying expires near its short strikes, making it a precise, range-bound instrument. The broken-wing version asymmetrically widens one wing, so the trader takes maximum loss on only one side, and can often enter at a reduced debit or even a credit in richer environments. In the Flyagonal, the call BWB captures upside drift and benefits from time decay. Its vega is slightly negative, meaning it benefits from volatility contraction. Traders can enter BWBs for a credit in high-IV environments, which improves probability of profit, but the Flyagonal structure requires a net debit entry, so that specific advantage shifts. The BWB’s primary contribution to the Flyagonal is its strong positive theta and its directional asymmetry above spot.
The put diagonal is placed below the current price. The structure sells a near-term put and buys a same-strike put in a later expiration. Because the longer-dated option carries more vega than the shorter-dated one, the position has net positive vega; it gains when implied volatility expands. Because the near-term option decays faster than the back-month option, the position also generates net positive theta. When the market drops and volatility spikes, the long put’s vega gains more than the short put loses, and the diagonal expands in value. Its weakness: in persistently quiet markets with contracting IV, the position’s vega advantage erodes and the theta differential alone may not be sufficient.
Why the Combination Works
The mechanical heart of the combination is that these two vega profiles approximately offset each other at entry. The BWB contributes slightly negative vega; the diagonal contributes slightly positive vega. The net result is close to vega-neutral at inception. This is what allows the Flyagonal to function across different volatility regimes rather than being locked into one.
The regime tension is worth stating precisely. The BWB component benefits from volatility contraction; it would prefer to enter when IV is elevated so it can decline during the trade. The diagonal component prefers a low-IV entry because the long put in the back month is cheaper, making the debit more manageable. These preferences point in opposite directions. The reason the Flyagonal is generally treated as a low-IV strategy is that the diagonal’s requirement for affordable long-dated exposure tends to dominate: when the long put is cheap, the debit is small, risk is limited, and the structure is cost-effective. A sophisticated trader holds both sides of it simultaneously rather than pretending the BWB’s vega preferences don’t exist.
The Real Edge: Path, Not Prediction
Most traders think about options in terms of direction: up, down, or sideways. The Flyagonal is more subtle than that. It cares about the path – how fast the market moves, whether volatility rises or falls, which expiration responds more to a given move, and whether theta has enough time to accumulate before gamma becomes dangerous.
A slow drift higher is very different from a 3% gap up. Both are bullish outcomes, but they produce completely different results in this position. The slow drift gives the BWB time to decay profitably while delta stays manageable. The gap up pushes the underlying through the short strikes before the position has time to work, and the diagonal’s downside positioning provides no offset. A controlled pullback with moderate IV expansion is very different from a cascading crash where near-term implied volatility explodes faster than the back-month put can compensate. The mechanics are identical in both scenarios, but the outcomes are not.
Entry Timing Matters More Than Direction
The Flyagonal is not a bet that SPX finishes at one specific price. It is a bet on the path. The strategy wants time to pass, the market to stay within a manageable range, and volatility changes to benefit one side faster than they hurt the other. A slow grind higher, a quiet sideways market, or a mild pullback with controlled IV expansion can all work. A violent gap up, a persistent downside trend, or a term-structure distortion where front-month IV spikes disproportionately can all break it.
That path dependency is the real trade, and it is why entry timing and regime selection matter more than directional conviction. When you enter a Flyagonal, you are not predicting where SPX will be in five days. You are selecting a volatility path you consider probable given current conditions and building a structure that profits if that path materializes. The regime filter is a path filter. You are screening out the environments where the wrong path is most likely.
How It’s Constructed
The setup requires precision on four variables: strikes, expirations, width, and placement relative to spot.
Call broken-wing butterfly:
- Place approximately +40 points above spot on SPX
- Buy one lower call, sell two calls 25-30 points higher, buy one call further above the short strikes, with the upper wing wider than the lower wing to create the broken-wing asymmetry
- All three legs at 8-10 DTE
Put diagonal:
- Short put approximately -40 points below spot on SPX, at 8-10 DTE
- Long put at the same strike in the 16-20 DTE expiration
- The time gap between short and long creates the differential theta and vega profile described above
Cost: Typical entry debit ranges from $400-700 per SPX contract, or approximately one-tenth of that in SPY. This debit is the maximum possible loss, defined completely at entry.
Greeks at entry:
- Delta: approximately zero
- Theta: strongly positive, typically +$60 per day per SPX contract
- Vega: approximately neutral; the BWB’s slight negative vega and the diagonal’s slight positive vega roughly offset
Ganz later developed spin-offs: the Conagonal (condor + diagonal) and Vertagonal (vertical + diagonal). Both operate on the same hybrid logic of pairing a theta-positive defined-risk structure with a diagonal for vega balance. The original fly + diagonal remains the foundation and, by most accounts, the most elegant form.
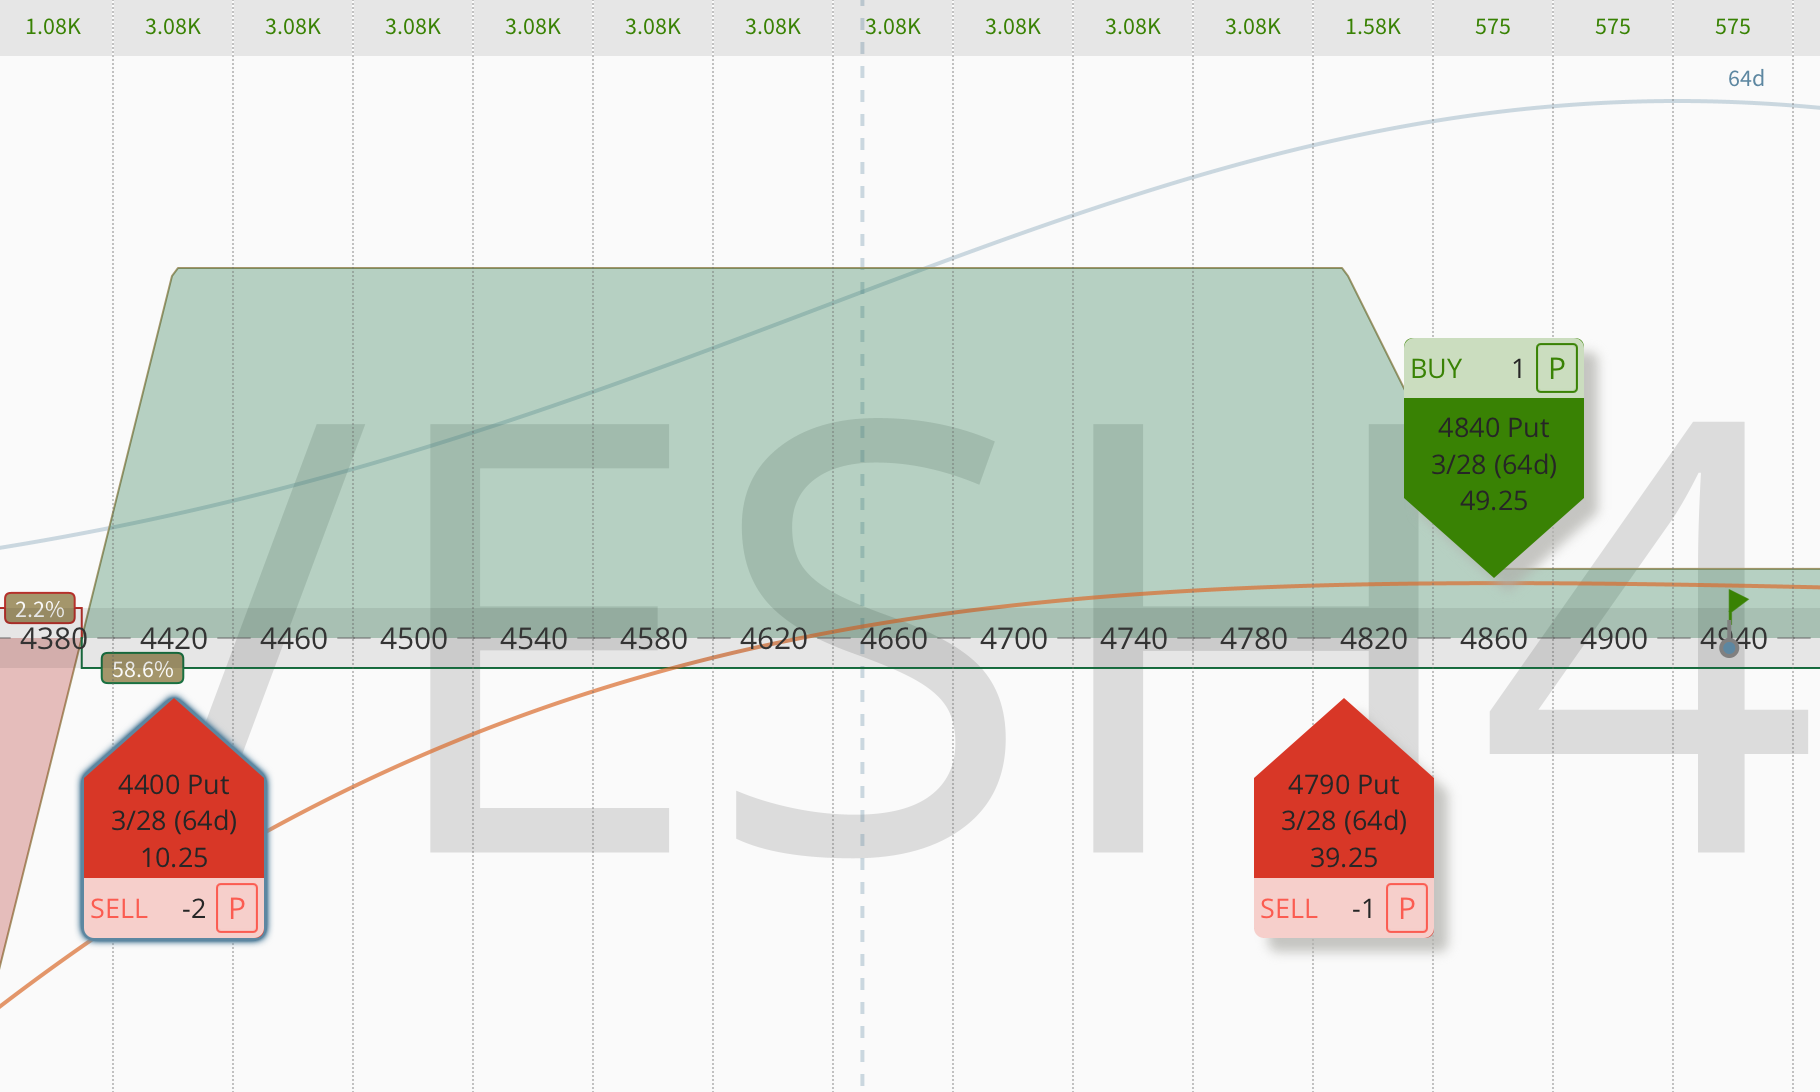
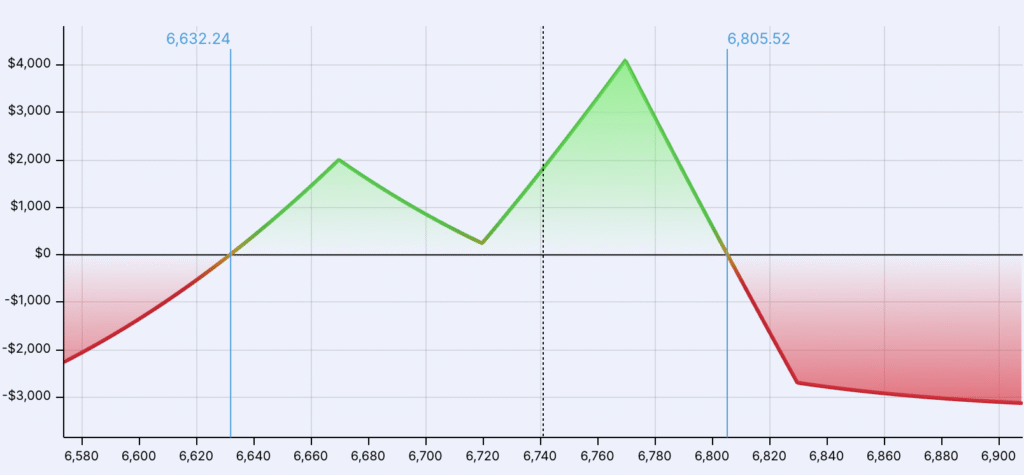
My Example Trade
SPX is at 6,100. You set up a Flyagonal.
[SCREENSHOT]
Call side (8 DTE):
- Buy 1 × 6,125 call
- Sell 2 × 6,150 calls
- Buy 1 × 6,180 call
Put side:
- Sell 1 × 6,070 put (8 DTE)
- Buy 1 × 6,070 put (16 DTE)
Total debit: approximately $400-500. Maximum loss.
At entry: delta ≈ 0, theta ≈ +$60 per day, vega ≈ neutral.
Day 1: SPX flat at 6,100. Position up modestly from theta.
Day 3: SPX still between 6,070 and 6,150. The position is typically up 7-10%. On a $2,500-5,000 risk base that is $175-500 in three days. Many traders exit here, recycle capital, and look for the next setup.
Day 5: Without a significant move, the position is often up 15-20% or more as theta accelerates. Most of Ganz’s live trades were closed before this point to avoid gamma risk building in the final days.
When to Enter
The Flyagonal is built for specific conditions. Enter when:
- IV rank is below 15 – the long put in the diagonal is affordable, and the short options still generate enough theta to make the debit reasonable
- 8-10 DTE for the butterfly and short put; 16-20 DTE for the long put
- The calendar is clear of FOMC, CPI, earnings, and other binary events within the holding period
- The market is in a grinding, range-bound, or slowly drifting environment, not in a sharp directional trend
The strategy works across underlyings. Ganz traded it primarily in SPX for its liquidity and strike granularity, but the same logic extends to SPY, QQQ, IWM, and large-cap single names like NVDA and TSLA. The consistency across underlyings is meaningful, it suggests the strategy captures a structural relationship between the two legs rather than being curve-fitted to a specific product or period.
Trade Management and Exit Rules
The Flyagonal isn’t a set-and-forget trade. Its edge comes from disciplined management. The profit target is approximately 10% of risk capital. With typical SPX risk of $2,500-5,000 per position, that translates to $250-500 per trade. Ganz’s average holding time across 110 live trades: 5.1 days. Positions are closed 3-4 days before expiration to avoid the gamma acceleration that builds in the final stretch.
Downside management is often self-correcting. When the market drops, implied volatility expands, the diagonal widens, and losses are cushioned. The more challenging scenario is upside: a sharp rally compresses the butterfly before the diagonal can compensate.
My common adjustments when needed:
- Roll the short calls higher to restore balance after an upside move
- Close the butterfly early while leaving the diagonal on, converting the position into a pure long put calendar
- Hedge delta using Micro E-mini futures (/MES) or short-dated calls for precise, rapid adjustments
Roughly half of all trades never required adjustments because profits were taken early. The remaining half required at least one touch, most commonly rolling the call side higher during brief upside moves.
The Live Results
When Steve Ganz first publicly presented the Flyagonal he had completed 60 live trades with 58 winners, a 96.7% win rate and $24,000 in profits over approximately ten weeks. As of October 2025, across 110 live trades, 104 closed as winners, a 94.55% win rate with approximately $30,000 in total profits over six months. Average risk per trade: $2,500-5,000 on SPX. Average hold time: 5.1 days.
The largest recorded loss on a single trade was $600 during a sharp SPX rally. The largest stress-event loss was $4,500 during the sudden 100-point SPX crash in August 2024 – significant, but manageable for a position sized appropriately within a broader portfolio. These are live trading results, not backtests.
A high win rate in a short-duration, defined-risk income strategy does not automatically mean high expectancy. The real question is the relationship between average win, average loss, maximum loss, and how often the rare loss appears. A strategy that wins 95% of the time can still be fragile if one loss erases 20 winners. The Flyagonal’s appeal is not just the win rate, it is the combination of short holding time, defined maximum risk, and early exits before gamma dominates. At $250-500 average profit on a $2,500-5,000 risk base, the math holds up even if the win rate normalizes downward from its current high, provided position sizing stays disciplined.
The Flyagonal vs. Similar Strategies
The Flyagonal is not the only strategy combining a butterfly and a diagonal. Simon Black’s Time Flies Spread uses the same structural combination – call broken-wing butterfly and put diagonal – but with different mechanics in strike placement, width selection, and management approach. Both emerge from the same insight: pairing a negative-vega structure with a positive-vega time spread can produce a more regime-resilient position than either leg alone. The specific execution differences matter for risk management but not for the underlying logic.
Compared to the iron condor, the Flyagonal offers a shorter holding period, a net debit rather than a net credit structure, and a different upside risk profile. The iron condor’s maximum loss sits at either extreme of the range; the Flyagonal’s maximum loss is the debit paid, realized in scenarios where the structure fails entirely rather than in moderate moves outside the range.
Compared to a calendar spread, the Flyagonal adds the butterfly component to capture upside theta more aggressively and create a wider profit zone above spot. The calendar is simpler but more vega-dependent and less adaptive across different market paths.
Where the Strategy Breaks
The Flyagonal breaks in specific, identifiable scenarios, and understanding them in advance is what separates disciplined deployment from painful surprises.
Sharp upside moves. A sudden 3-5% SPX rally pushes the underlying through the short calls of the butterfly before time decay can cushion the move. The diagonal provides no meaningful offset to the upside, it is structured below spot for exactly the opposite scenario. This is the primary risk and the one most likely to produce the worst outcomes.
Slow grinding downtrends. In January 2022, a slow 150-point grind lower over multiple sessions hurt both legs simultaneously. The diagonal expanded initially but lost value as the market continued lower and the short put came under stress. The butterfly decayed normally but provided no offset. The combination performed worse than either leg would have alone in that specific path.
Asymmetric volatility term structure. Models assume both expirations react evenly to volatility changes. In practice, near-term IV spikes faster and deeper than longer-dated IV during acute dislocations. In August 2024, the diagonal’s short leg bled faster than the long leg’s vega could offset, producing the $4,500 loss described above. This is the hidden risk in the structure; it only appears during sharp, sudden crashes rather than the gradual volatility expansions the diagonal was built to capture.
Every one of these failure scenarios is more likely in high-IV, event-heavy, or strongly trending environments. The entry filter is the primary risk management tool. It screens out the paths most likely to produce the wrong outcome.
Is the Flyagonal Right for You?
The Flyagonal deserves serious consideration from any experienced trader already fluent in butterflies, calendars, and condors. For traders still learning multi-leg structures, the construction and management requirements make it premature; you need to understand each component independently before combining them.
The regime requirement is strict: low IV, no major events, range-bound or slowly drifting market. The 96% win rate was achieved during a friendly, low-volatility environment. My stress-testing across different market regimes reveals materially lower consistency, which is not a disqualification, but a boundary condition that must be respected.
The right approach is to treat it the way Steve Ganz does: size it small relative to the portfolio, target 10% of risk capital per trade, exit early rather than late, and recycle capital quickly. At a five-day average hold time, the compounding effect across multiple cycles in a single month is what drives the returns. This is not a buy-and-hold trade. It is an active, high-frequency income structure that rewards discipline and punishes overstaying.
Try to break it before you trust it. Run it through August 2024, run it through January 2022. If it still holds up under your worst-case assumptions, it deserves a place in your playbook. And if it doesn’t, you’ll still gain what matters most: clarity about when it works, when it doesn’t, and exactly why. That knowledge alone makes you a stronger trader.
The OptionsJive Trading Plan covers the full framework for deploying structured income strategies like the Flyagonal alongside short premium positions, including position sizing, regime filters, volatility analysis, and decision trees for when to trade which structure and when to step aside.
What Comes Next: The Flydagonal
Once you’ve mastered the Flyagonal, Steve Ganz has a logical next step. He recently unveiled the Flydagonal, a more advanced, 8-leg options structure that takes the Flyagonal’s hybrid logic and amplifies it by adding a third component at the center.
Where the Flyagonal combines two structures, the Flydagonal combines three:
- An iron butterfly centered at the current market price
- A call diagonal spread above the market
- A put diagonal spread below the market
These three layers create what Ganz calls a “theta bomb” – a position where multiple independent sources of time decay work simultaneously, accelerating the rate at which the trade moves toward its profit target. The overlapping structures create a wide profit tent, and each component contributes its own theta while the position as a whole remains approximately delta-neutral.
How the Flydagonal Is Built
Construction: With SPX at 7,126, a typical Flydagonal might look like this. Sell an iron butterfly with short strikes at 7,125 and long strikes at 7,075 and 7,175. Add a put diagonal at 7,025/7,000 and a call diagonal at 7,225/7,250. The iron butterfly and the short legs of both diagonals expire on a Friday, typically 7-14 DTE. The long legs of the diagonals expire the following Monday, just three calendar days later. This three-day gap between the short and long expirations is deliberately narrow: it creates the differential theta needed to generate income while keeping the cost of the long legs minimal.
Targets: Steve Ganz targets 5-7% returns within the first one to two days, and 10-15% if the position is held slightly longer. Across approximately 50 live trades, his average hold time is four days, shorter even than the Flyagonal.
What makes it more resilient than the Flyagonal: The Flyagonal is inherently biased; the BWB component sits above spot and the diagonal sits below, so the position is directionally asymmetric. The Flydagonal’s iron butterfly at the center creates a symmetric profit zone centered on the current price, flanked by diagonals on both sides. This makes the strategy more agnostic to volatility direction – the butterfly benefits from IV contraction while the diagonals benefit from expansion – reducing the path dependency that the Flyagonal carries.
The primary risk is the same as the Flyagonal but with one additional failure mode: whipsaw markets. A sharp move down followed by a rapid reversal upward can cause compounding losses. Adjustments for the initial downside move can leave the position exposed to the subsequent rally. Ganz rates the overall risk at approximately 3-4 on a 10-point scale given the defined risk nature, but emphasizes that adjustments and position sizing discipline are non-negotiable.
Frequently Asked Questions
What is the Flyagonal options strategy?
The Flyagonal is a hybrid defined-risk options strategy that combines a call broken-wing butterfly placed above the current price with a put diagonal placed below it. Popularized by Steve Ganz, it produces near-zero delta, strongly positive theta, and approximately neutral vega at entry, creating a structure that can function across a range of market paths in low-volatility environments.
What is the Flyagonal win rate?
Across 110 live trades through October 2025, 104 closed as winners, a 94.55% win rate generating approximately $30,000 over six months. The original 60-trade track record showed 96.7%. These are live trading results in predominantly low-volatility conditions, not backtests.
How is the Flyagonal constructed?
On SPX: buy one call, sell two calls 25-30 points higher, buy one call further above, all at 8-10 DTE, placed approximately 40 points above spot (call BWB). Simultaneously: sell one put approximately 40 points below spot at 8-10 DTE, buy the same strike in the 16-20 DTE expiration (put diagonal). Total debit: typically $400-700 per SPX contract.
Why does the Flyagonal prefer low implied volatility?
The BWB component benefits from volatility contraction and would technically prefer higher IV for richer short strike premiums. The put diagonal’s long back-month put is cheaper in low-IV environments, keeping the total debit manageable. The low-IV entry preference reflects the diagonal’s requirements dominating the combined structure, though the tension between the two legs’ IV preferences is a real and important nuance.
What is the maximum loss?
The net debit paid at entry; typically $400-700 per SPX contract. The position cannot lose more than what was paid, making maximum risk completely defined from the moment of entry.
What are the Flyagonal spin-offs?
Steve Ganz developed the Conagonal (condor + diagonal) and Vertagonal (vertical + diagonal) as variations applying the same hybrid logic to different base structures.
How does it compare to an iron condor?
The iron condor collects a net credit with maximum profit at expiration between short strikes. The Flyagonal pays a net debit with maximum profit from a combination of theta decay, moderate upside drift, and vega balance over a short holding period. The iron condor has a wider expiration-date profit zone; the Flyagonal typically closes well before expiration where its profit zone is widest and gamma risk lowest. Both are defined-risk income strategies suited to different regimes and holding periods.
What is the biggest risk?
A sharp, fast upside gap. The broken-wing butterfly’s short calls get overwhelmed before time decay can cushion the move, and the put diagonal below spot provides no offset. This is why the entry filter is the primary risk management tool; no major events within the holding period, no strong trending market.
What is the Flydagonal?
The Flydagonal is an advanced 8-leg evolution of the Flyagonal developed by Steve Ganz. It adds an iron butterfly at the center to the Flyagonal’s call and put diagonals, creating multiple simultaneous sources of theta decay, what Ganz calls a “theta bomb.” The structure targets 5-10% returns within a few days and is designed to be more volatility-agnostic than the original Flyagonal.