


Most traders approach earnings like gamblers. They focus on whether the company will beat or miss, look at the implied move, decide it looks fat, sell a strangle, and wait for IV to crush after the print. It works often enough to feel like skill. Then one quarter it does not work, and the loss erases months of careful premium collection. It is the wrong framework applied to the wrong problem.
That is not how we approach it in our hedge fund. The real edge is to find where the option surface is distorted, decide whether the market is overpricing or underpricing the event, and then choose the structure that fits that exact setup. Sometimes that means selling front-week event volatility. Sometimes it means owning deferred convexity. Sometimes it means doing nothing at all. That last one is more important than most traders want to admit.
The real edge is in the term structure
The cleanest and most repeatable feature of earnings options is the way earnings bends the term structure. The expiration that contains the announcement carries a large chunk of the event risk, so its implied volatility rises sharply into the print. The next weekly expiration often rises too, but much less. After the release, the front expiry loses that event premium very quickly. 
Dubinsky, Johannes, Kaeck, and Seeger (2019) formalized this by separating ordinary day-to-day volatility from the distinct uncertainty component that builds around earnings announcements, one that is explicitly concentrated in the event expiry and largely absent from surrounding expirations. ORATS’ earnings work makes the same point in practitioner terms by comparing IV with earnings and IV with earnings taken out.
That is why the right question is not “should I sell premium before earnings?”. The right question is: which part of the surface is mispriced, and what structure isolates that mispricing best? Once you start thinking that way, earnings stops looking like a coin flip and starts looking like a relative-value problem.
The Oracle Reminder
If you watched Tastylive around September 2025, you saw how painful the default short-strangle mindset can become when the market is underpricing a genuine regime shift rather than overpricing noise.
Tom Sosnoff built a career arguing that selling premium into elevated IV (strangles especially) is the percentages play. The research base behind Tastytrade is full of that DNA, and on most events, over most cycles, the logic is sound. The problem is when traders start treating it as a default setting that requires no further analysis.
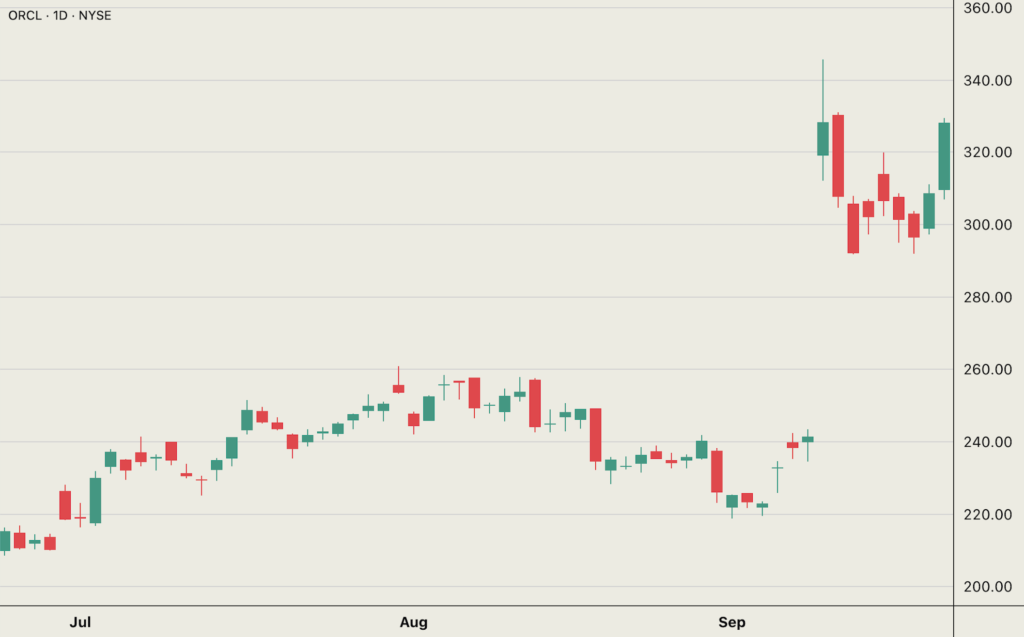
Oracle’s fiscal Q1 2026 report, released after the close on September 9, 2025, was the kind of event that stress-tests that philosophy at its worst. Oracle reported remaining performance obligations up 359% year-over-year to $455 billion and cloud revenue up 28%. The stock surged nearly 36% the following day to an intraday record of $345.72, its largest single-day percentage gain since 1992. The market was still underestimating a genuine regime shift. That is the tail risk this framework is built to filter for.
Three Questions Before You Choose a Structure
Before selecting any earnings trade, I answer three questions in this order. The structure follows from the answers. Never the other way around.
- Is the implied event move actually rich relative to this stock’s own history?
- What is the shape of the short-dated IV surface right now?
- Does this name tend to drift after the earnings reaction?
Each question eliminates a category of bad trades. Together they determine which structure (if any) actually fits the setup.
Question 1: Is the Implied Event Move Actually Rich?
This is the first filter because earnings uncertainty is not always overpriced. That sounds obvious until you watch how many traders skip this step entirely.
Gao, Xing, and Zhang found that at-the-money straddles opened three days before earnings earned a statistically significant average return of approximately 3.34% in their sample. That is a crucial result. A positive return for buyers means the average earnings event in their data was not overpriced, it was fairly priced to slightly cheap. The market is not systematically biased toward overpricing earnings risk. It depends on the name, the sector, and what kind of quarter it is.
My practical implication: compare the current implied event move with that stock’s own realized earnings move history. If the implied move sits near the stock’s median historical earnings move, there is no compelling reason to force a short-vol trade. If the event premium is clearly above that history, the short-front / long-back structure gets interesting. That one step removes a significant number of bad trades before they start.
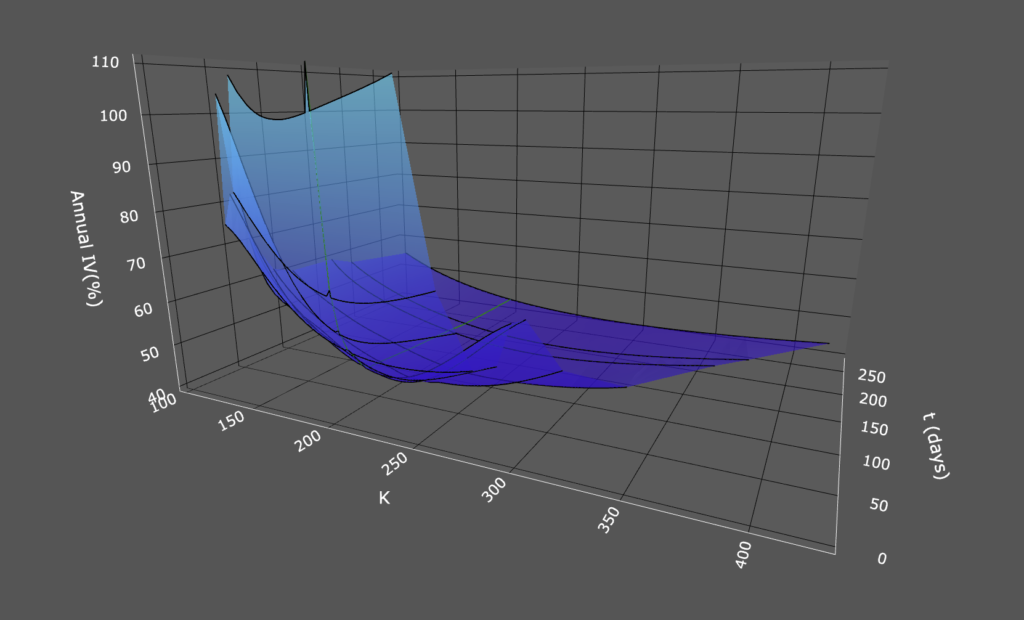
Question 2: What Is the Shape of the Short-Dated IV Surface?
This is the filter most retail traders ignore entirely, and it is probably the most important one.
Alexiou, Goyal, Kostakis, and Rompolis (2025) show that short-dated IV curves often become concave before earnings; meaning the wings get bid in a way that signals the market is pricing a more bimodal, more jump-prone outcome. Their paper finds that stocks with concave IV curves exhibit larger absolute moves on earnings day, higher realized volatility afterward, and materially worse returns for delta-neutral structures, including straddles, strangles, and calendar spreads.
A simple diagnostic: compare the average IV of the 10-delta call and 10-delta put with ATM IV. Treat that ratio as a house signal, not a precise threshold, but if it is stretched well beyond the stock’s normal pattern, stop thinking “easy IV crush” and start thinking “tail-risk candidate.” Reduce size, move to a defined-risk structure, or pass entirely. That distinction is often the difference between a professional filter and a retail blow-up.
Question 3: Does This Name Tend to Drift After the Event?
Not every earnings trade ends the morning after the print. Some names gap and stop. Others gap and keep going for days or weeks.
Post-earnings announcement drift (PEAD) is one of the most durable anomalies in academic finance. Stock prices frequently continue moving in the direction of an earnings surprise rather than fully adjusting on day one. The effect is stronger in smaller, less-covered names where the market processes new information more slowly, but it appears across the size spectrum in varying degrees.
My practical point: a one-day event-volatility trade and a post-event continuation trade are two different edges, even when they start from the same earnings report. If a name has historically kept moving after big prints, a structure that captures only the event-day IV crush leaves the majority of the real move on the table. That leads directly to structure choice.
My Default Institutional Trade: The Term-Structure Diagonal
When the front-week event premium is rich, the surface is smooth, and there is no strong continuation signal, my cleanest default earnings structure is a calendar spread or diagonal.
ORATS published a backtest covering 5,217 earnings announcements and 20,868 trades across four strategies – buying straddles, selling straddles, buying calendars, and selling calendars – using January 2020 to July 2021 as the in-sample period and July 2021 to October 2021 as out-of-sample. In that out-of-sample window, the long calendar was the best-performing strategy. Long straddles and short calendars were the weakest. This is not a universal law. Markets evolve and the volatility environment during that period had its own texture, but the result is structurally consistent with how I think about the earnings term structure.
The logic is straightforward. The short leg captures the premium that is most inflated, the event-week expiry. The long leg in the next expiry retains real vega after the print because its implied volatility does not collapse as dramatically. The position is not a disguised naked short. If the stock moves hard, the long leg provides meaningful offset.
My practical bullish implementation:
- Short leg: earnings-week call, approximately 20-30 delta
- Long leg: next-week call, approximately 40-60 delta
- Long strike positioned one to three strikes below the short strike
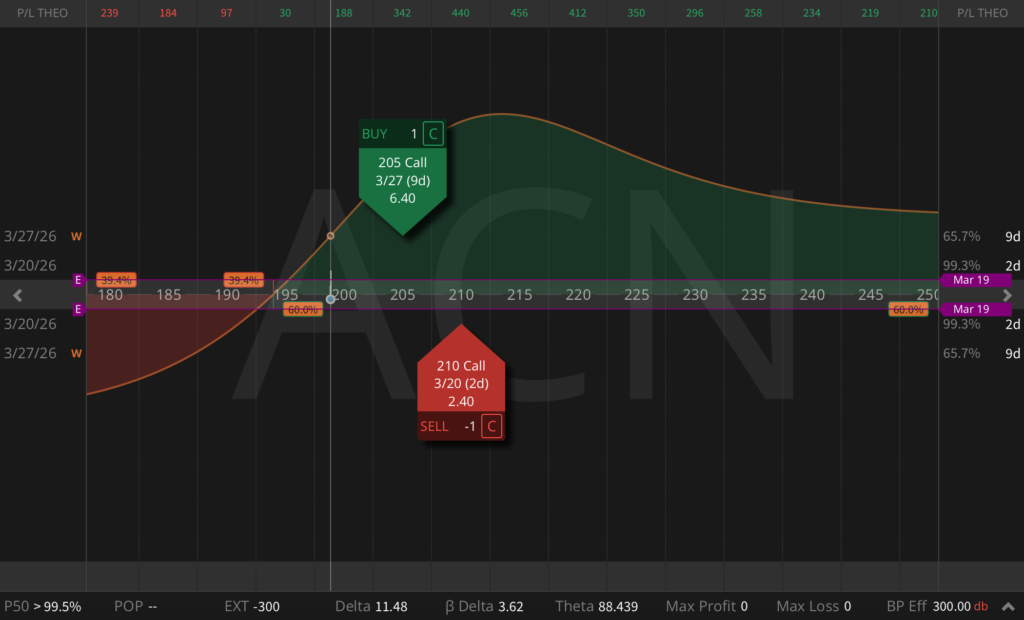
The bearish version mirrors this on the put side. The exact strikes depend on your directional lean, your read on the surface, and how much anchor you want in the long leg relative to the premium collected from the short. If I have to choose one default earnings structure, this is it.
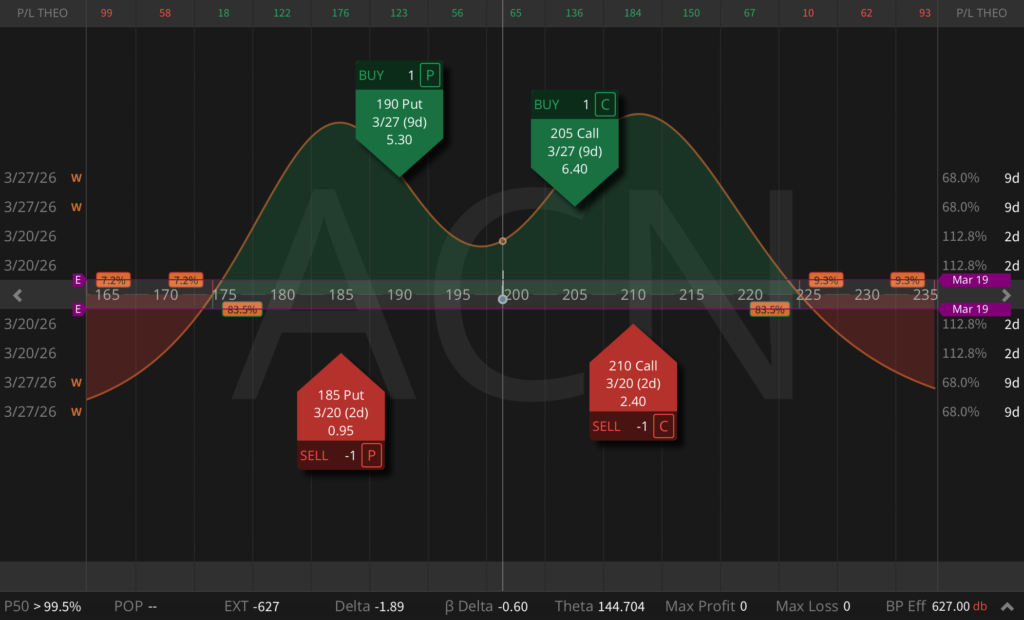
The Neutral Sleeve: The Double Diagonal
When I do not want to lean directionally but the front-week premium is rich on both sides and the surface is clean, a double diagonal is the cleaner expression.
It lets you sell event premium on both the call side and put side of the front expiry, while owning deferred optionality in the next weekly. It is a more balanced structure than a naked short strangle, with defined risk and a long-volatility anchor that survives the event. It is not the most exciting trade, but that is exactly why I like it for setups where the edge is moderate and the uncertainty is bilateral.
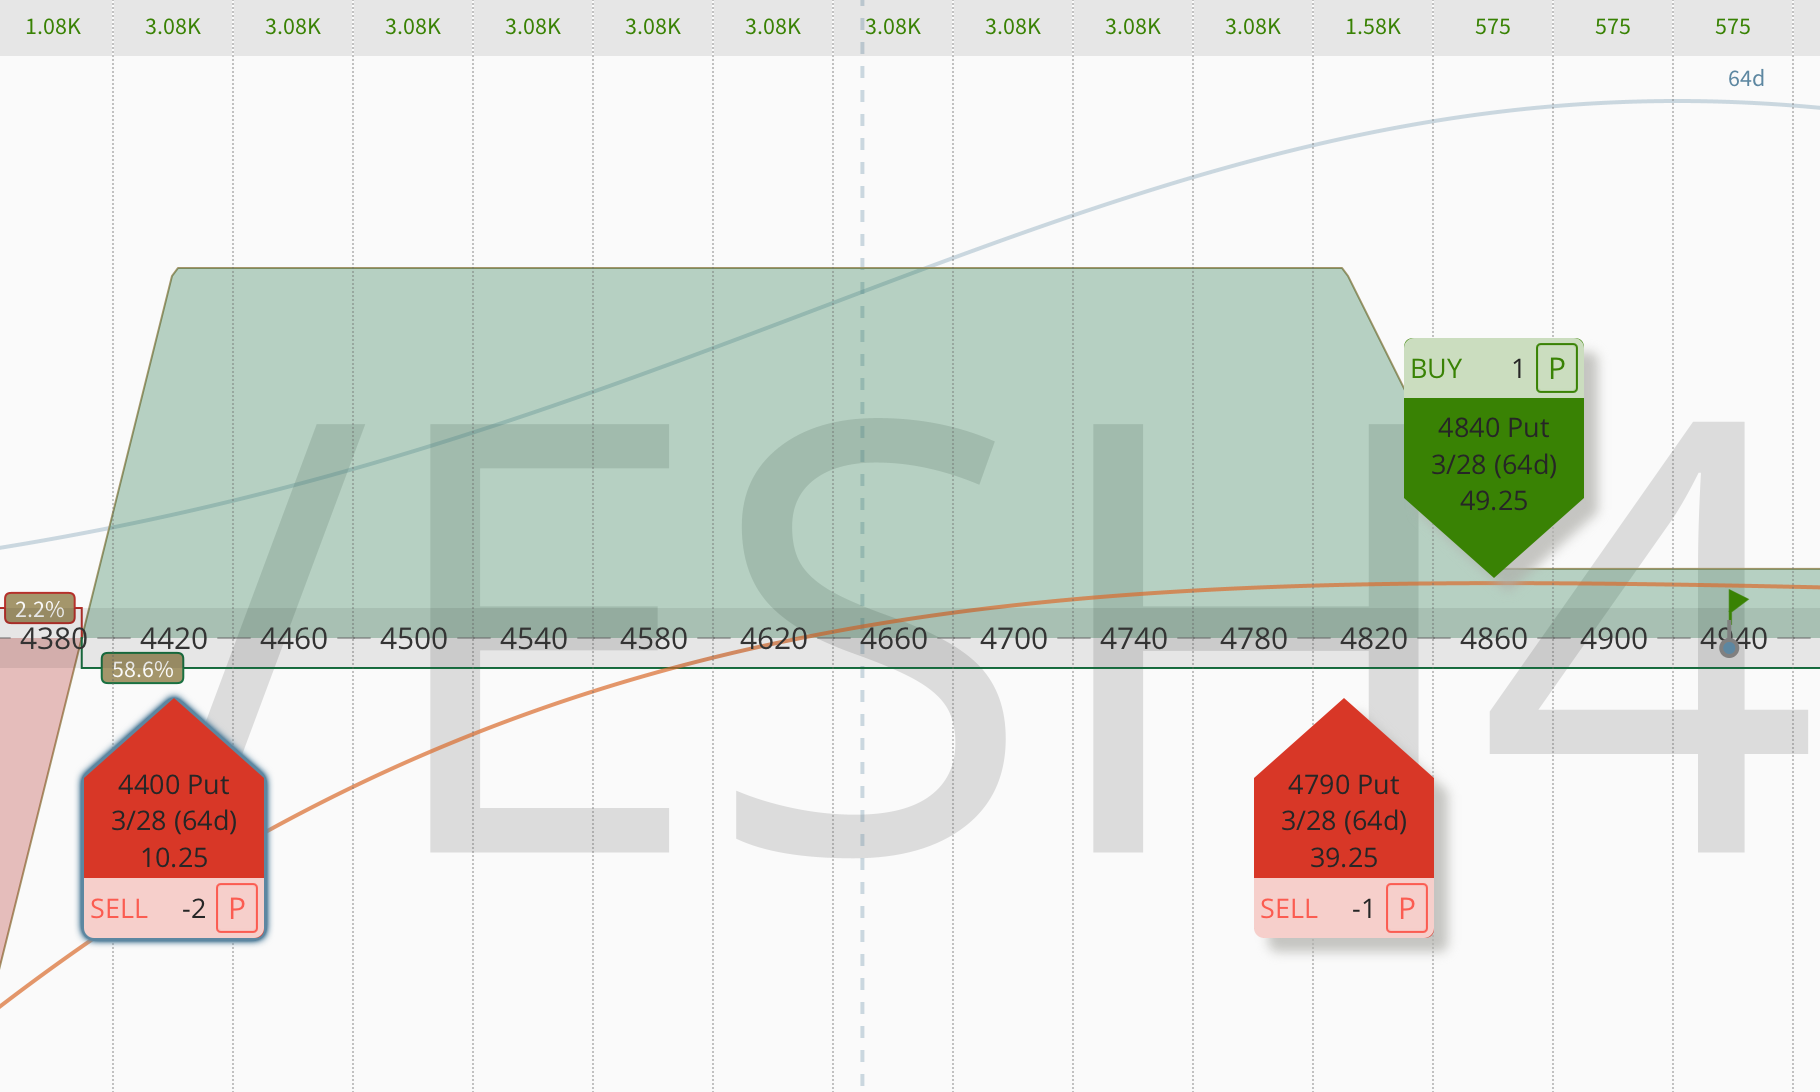
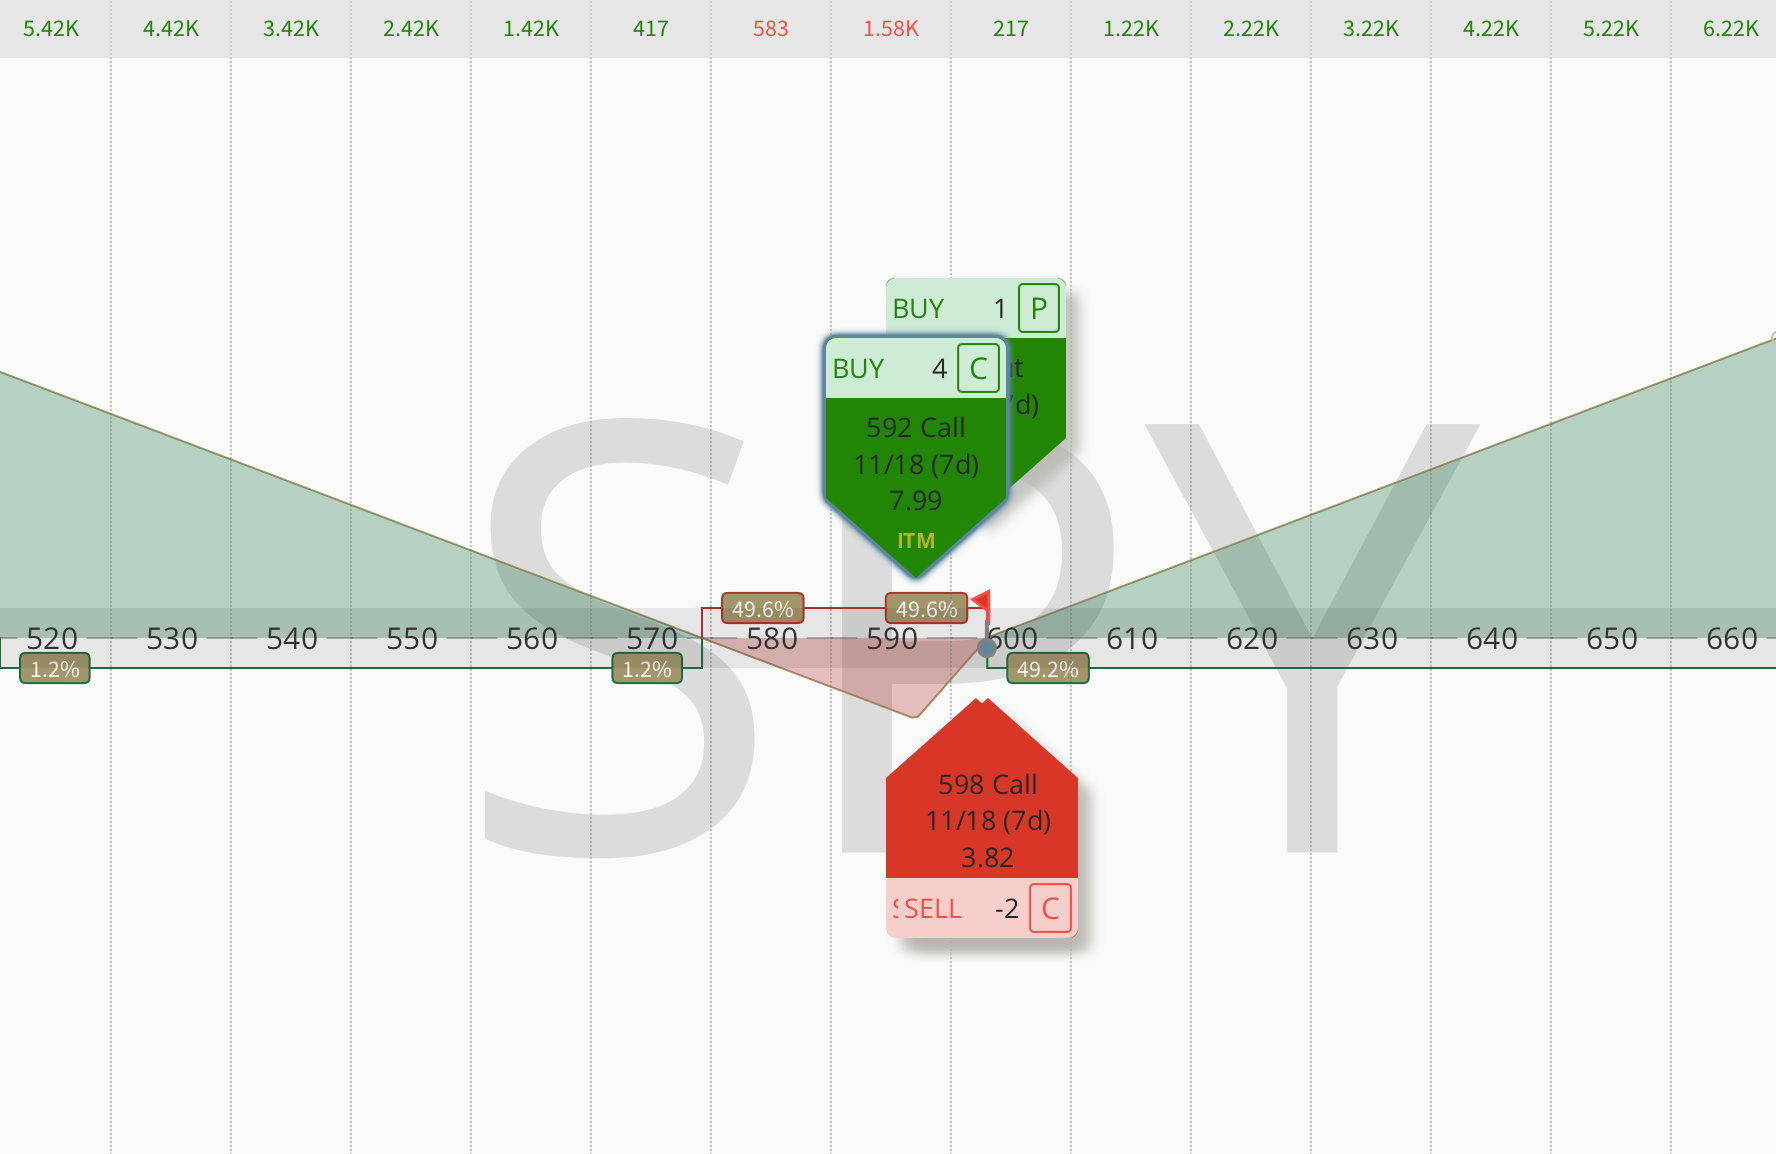
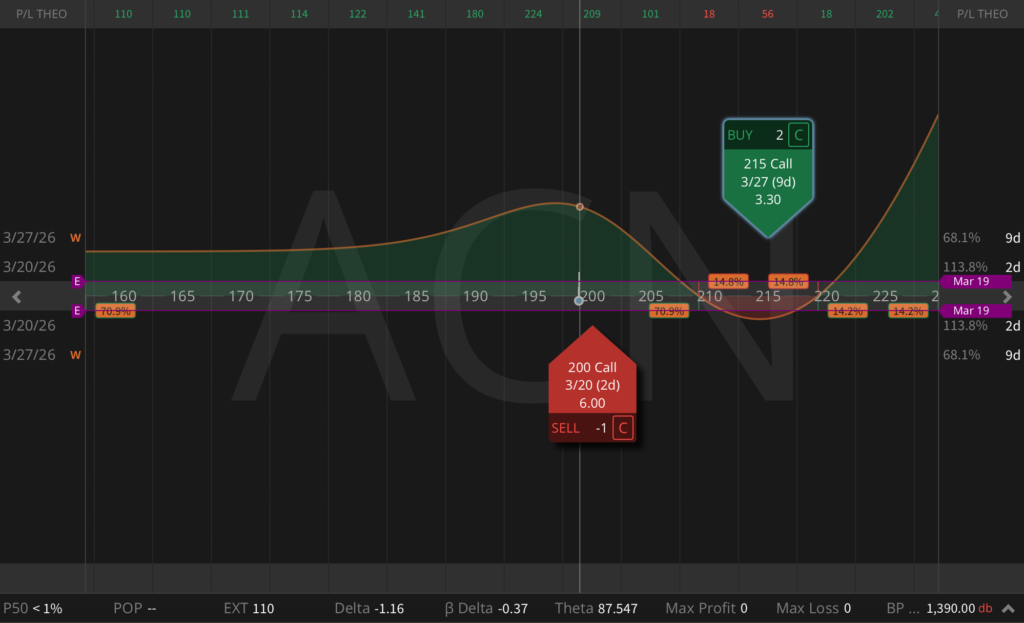
The Advanced Sleeve: The Long-Ratio Diagonal
When the front-week premium is extremely rich, skew is favorable, and the name has genuine continuation potential, a plain diagonal can be upgraded into a long-ratio diagonal. This structure is a different animal from a standard educational diagonal, and the strike arrangement that makes it work is the opposite of what most teaching material describes.
A standard diagonal is built like a defined-risk directional trade: long the closer strike in the back expiry, short the farther strike in the front expiry. The goal is a clean directional expression with capped risk. That is fine for a moderate earnings lean.
The long-ratio diagonal for an earnings continuation sleeve is built differently: the short front-week calls sit closer to at-the-money, and the deferred long calls sit moderately out-of-the-money, in a ratio greater than 1:1. The objective is a term-structure convexity transfer; sell the richest piece of event IV where the distortion is most concentrated, use that sale to finance cheap deferred optionality.
Earnings IV premium is concentrated near at-the-money. That is where the market explicitly prices the expected-move uncertainty. A front-week ATM call at 100% implied volatility might be worth $7.00. A front-week 15-delta call in the same expiry is worth $1.60. That $5.40 difference is the financing gap that determines whether the structure enters as a credit or a debit, and whether you can afford enough back-week longs.
Buying OTM back-week calls is cheap, they give right-tail convexity, and their low cost is what makes the ratio affordable at a credit. But pushing the long strike too far out-of-the-money creates a severe valley (a zone of meaningful loss) in the exact range where a solid-but-not-spectacular earnings beat is most likely to land. The numbers show this clearly: at a 2x ratio with far OTM longs (say, 10+ points above spot), the at-expiry valley can reach -$5 to -$7, maximum pain precisely where the stock is most likely to land after a normal beat. Bring the long strike in to moderately OTM and drop the ratio to 1.5x, and that valley flattens to near zero when the back-week time value is preserved.
The ratio is the control lever. Increasing the ratio progressively fills the valley by adding back-week extrinsic value that cushions the zone between the strikes. But it also reduces the upfront credit. The sweet spot, where the valley is materially reduced without giving up the credit entirely, is typically a 1.5x ratio with a moderately OTM long strike.
My practical template:
- Short leg: 1x front-week call, 40-50 delta (near ATM or slightly OTM), in the earnings expiry.
- Long legs: 1.5x back-week calls, 25-35 delta (moderately OTM), one expiry further out.
- Net position: small credit at entry; if the structure requires a debit, the back-leg strike is too expensive or too far away.
- Always run the payoff diagram before entry. The zone of maximum loss should be narrow and shallow, ideally less than half the credit collected.
The structure works because it profits in three of the four possible outcomes. The stock drops: the full credit is retained, the front short expires worthless, the back longs decay partially. The stock moves to a normal beat: both sides partially offset and the back-week time value cushions the valley. The stock explodes: the OTM longs dominate and the trade accelerates into significant profit. Only the precise valley zone (a narrow band between the strikes at front expiry) produces loss.
What the Research Actually Says, and What It Doesn’t
It is worth being precise about the boundaries here, because loose citations are how people get into trouble. Gao, Xing, and Zhang establish that earnings uncertainty is not systematically overpriced, which means short sellers need filters. The paper does not say long straddles are always the answer.
Alexiou, Goyal, Kostakis, and Rompolis (2025) establish that concave surfaces signal elevated tail risk and worse short-vol outcomes, which makes concavity a practical danger filter. The paper does not tell you where to place strikes or how to size.
The ORATS backtest establishes that term-structure-first thinking outperformed naïve premium-selling in their specific test window. It does not prove calendars will dominate every future market regime.
What the research gives you is a framework with three well-supported pillars: the term-structure distortion as the core edge, surface concavity as the risk filter, and PEAD as the structure modifier. Everything beyond that (the specific delta targets, the ratio, the strike geometry) is implementation. There is no formula that generalizes across all names, all surfaces, and all IV environments.
My Takeaway
I have traded through enough earnings cycles to know that the traders who blow up are rarely the ones who got the direction wrong. They are the ones who skipped the filter. They saw a big implied move, assumed the market was being sloppy with pricing, sold the strangle, and found out the hard way that Oracle’s cloud pipeline or a biotech readout or a Fed-sensitive bank can move in ways that no historical median prepares you for.
The framework in this article is how I actually approach every earnings event before I put on a single contract. Start with richness. Check the surface shape. Ask whether the name drifts. Then, and only then, choose the structure.
Most of the time the answer is a calendar or diagonal and you move on. Occasionally the setup is clean enough for the ratio diagonal. Rarely is it clean enough for a naked short strangle, and when the wings are concave, that answer is never. Filtering is the only reason my consistent P&L exists at all.
If you want the full PhD-level framework for trading options consistently, covering position sizing, structure selection, and the complete decision trees I use across all setups, it’s all inside my Trading Plan. Everything in this article is just one piece of a much larger system. If you want to learn a completely different earnings strategy with a 96% win rate, you’ll find that there as well.